This article is the second in a series about research the NCSPA conducted with funding from soy checkoff in 2014 and 2015 to investigate fungicide application, timing and effectiveness. This post presents the results of the research projects.
It is important to review the findings in the context of the weather in 2014 and 2015. 2014 saw a relatively cool summer across Eastern N.C. with higher than average rains in Aug. and Sept., followed by a fairly normal fall. The cool, wet conditions in late summer and early fall lead to an ideal environment for disease development during pod set and fill. In contrast, 2015 brought a hot, dry summer leading followed by an extremely wet late fall and early winter. The hot, dry conditions of July, Aug., and even the beginning of Sept. were not very conducive to disease development during pod fill. Frogeye leafspot incidence was rated on a scale of 1 to 10, with 10 being the most severe.
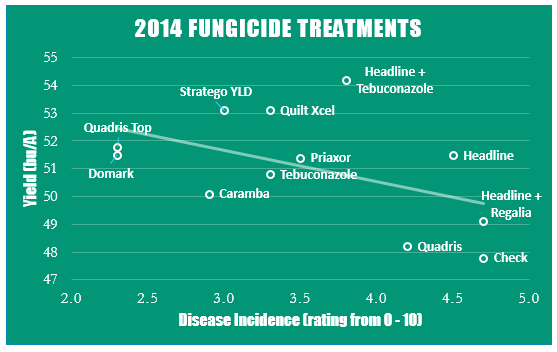
As expected based on weather patterns, there was moderate disease in 2014 and very little disease in 2015. This could also be the result of using a FLS-susceptible variety in 2014 and a resistant one in 2015. In 2014, when there was moderate FLS development, there was numerically lower FLS incidence in all 11 fungicide treatments compared with the untreated check. Notice there is some correlation between yield and FLS disease incidence for the 2014 data. Typically, as disease incidence increased, yield decreased.
The lack of disease in 2015 makes comparing treatments in that year difficult, but based on the data, the use of a fungicide treatment regardless of the product or timing did not decrease FLS incidence compared to the untreated check.
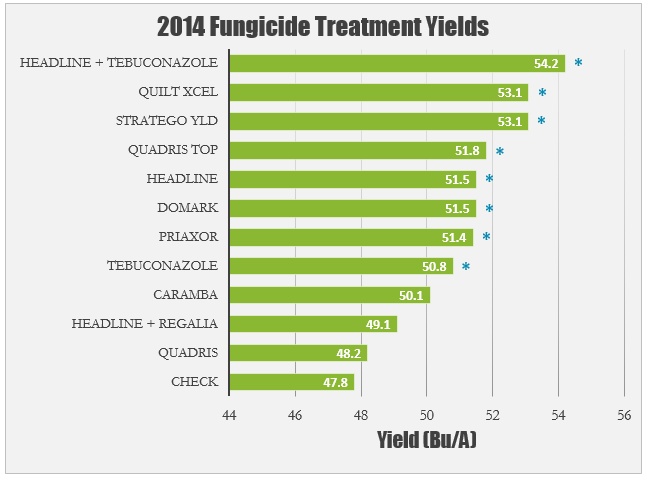
The more important question is not about disease incidence but about yield, and how that may affect potential profits. This experiment was designed to see if foliar fungicide applications can lead to increased yields/profits and if so, which products may give the highest return on investment. All products were applied in R3 in this experiment. In 2014, the average yield across all locations was 51.05 Bu/A, a fairly respectable year. The untreated check was the lowest-yielding entry, and there were significant differences in yields of the fungicide treatments compared to the check. All treatments with an asterisk yielded significantly higher than the untreated check, suggesting fungicide applications may be a sound investment.
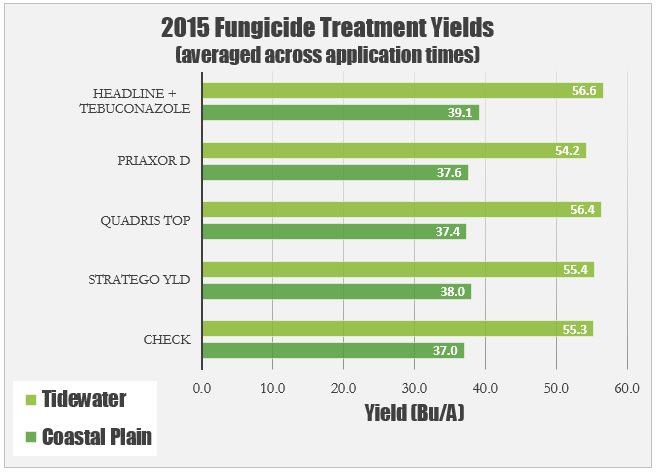
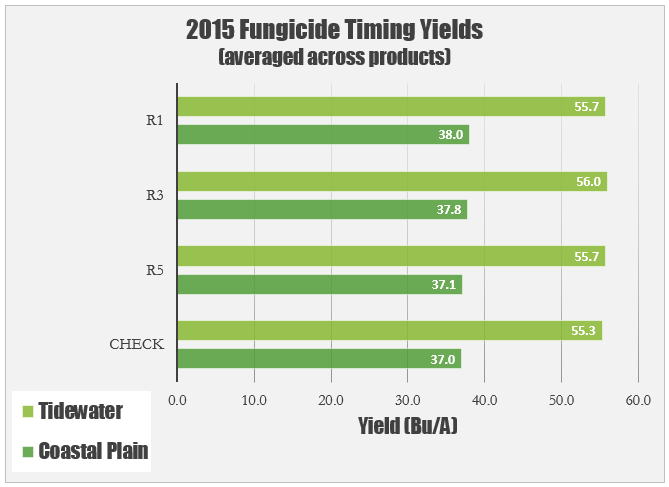
The story is a little different in 2015 when there was very little disease and lower yields compared to 2014. There were also saw some pretty big differences in yield between the Coastal Plain and Tidewater locations. For that reason, it is helpful to look at these two environments independently. The goal of the 2015 experiment was to see if there was any difference in applying fungicides at one growth stage versus another. Four of the promising products from 2014 were applied at three different growth stages. Each product was averaged across all application timings so to determine if one product performed better than the others. There were no differences between products, but more importantly there were no differences compared to the untreated check. Application of a fungicide did not improve yields over the untreated check in either the Coastal Plain or Tidewater locations.
Since the experiment showed no differences between the individual products, all products were averaged for each timing to see if applying at one timing is more beneficial than another. There were no differences in yield between the three different timings, meaning in 2015 there was no advantage to spraying at one growth stage versus another.
Look for the final post in this series next week that will provide information on how to interpret these results and consider if an investment in fungicides is worthwhile.


