Over the past two years, the US agricultural sector has been hit by a trade war with China (April 2018-present), the global disruption of African Swine Fever (August 2018-present), a series of hurricanes beginning with Florence (September 2018), and flooding in the corn belt (June 2019) all aggravated by a strong dollar that has made it more difficult to compete in the export market. The unrelenting pressure on farmers has been buffeted somewhat by ad-hoc relief programs but key farm financial indicators clearly point to increasing strain on America’s farms.
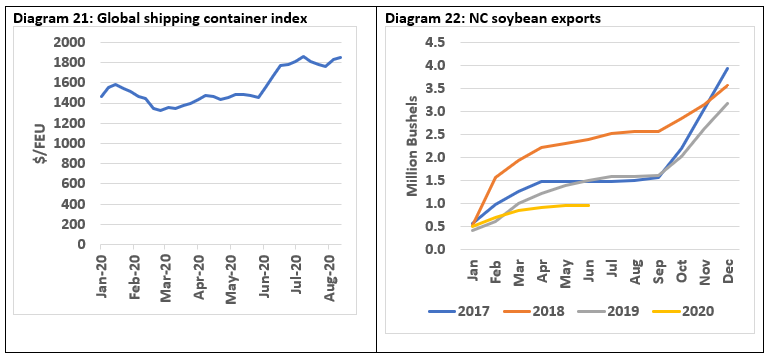
Diagram 1 illustrates this point using two indicators commonly used by Ag lenders. At 0.16, the debt-to-equity ratio in the Ag sector is now at its highest level in over a decade albeit still at a level considered healthy by most lenders. More troubling, however, is that the current ratio (current assets/current liabilities), a measure of liquidity, is at its lowest level since the USDA began reporting it in 2009 and approaching the 1.3 threshold that lenders view as vulnerable. The mounting financial stress on US farms has translated into a steady increase in farm bankruptcies at the national level since 2015 even while the diversity of in-state operations has helped stave off the same trend in North Carolina thus far.
2020 has added insult to injury with yet another unwelcome event – namely the novel Coronavirus, also known as Covid-19. In this blog post, we seek to tease out the impacts of COVID on different players in the value chain, with a particular focus on how the virus has impacted supply chains in North Carolina. In the course of this discussion we find that while 2020 has brought significant disruption to food supply chains, the pain has been very unevenly distributed amongst its various actors.
- At the retail level, COVID rerouted foot traffic from restaurants to retailers, giving the latter group pricing power and ultimately profit.
- In the main, COVID was a negative development for the livestock sector. Farmgate prices for livestock fell as a result and while wholesale margins were up, these were generally superseded by higher processing costs. Interestingly, if stock price is any indicator, it would appear the nation’s largest pork producer Smithfield, has avoided the worst of COVID-related disruptions. Through its parent company, WH Group, the entity was uniquely positioned to exploit a global supply chain and purchase pork cheaply in the US and sell it into a high-priced Chinese market still inflated by African Swine Flu.
- While throughput at meatpackers has nearly recovered, COVID disrupted the slaughter, production, and feeding of millions of animals. This weighed on meal prices while low petroleum prices were bad for the price of soy oil. Although markets for the component parts of soybeans have suffered, soybean farmers have been buffeted from the worst of it by lower crush margins.
- In the case of North Carolina, 2020 has ushered in an appreciable improvement to basis, due perhaps to a recovery in rail rates. Historically the Fayetteville plant has enjoyed some of the largest crush margins in the country, though the recent rally in the North Carolina basis has led that margin to converge with other parts of the country.
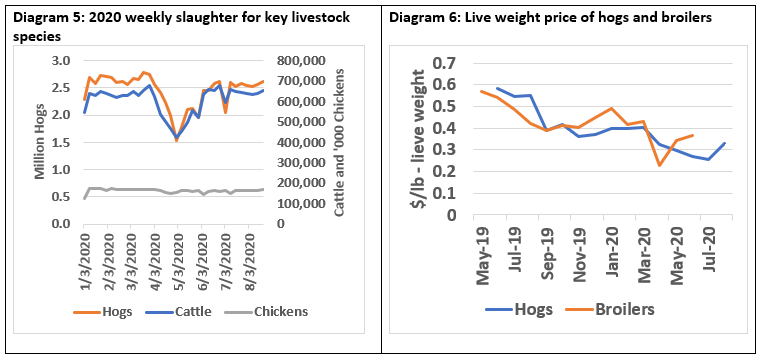
- North Carolina soybean exports are predicated on the availability of favorable rates for container exports, another aspect of the supply chain disrupted by COVID. With a higher basis and fewer available containers, the pace of North Carolina soybean exports is down 50% relative to last year and 60% relative to 2018.
COVID has shifted food dollars away from restaurants and towards retailers
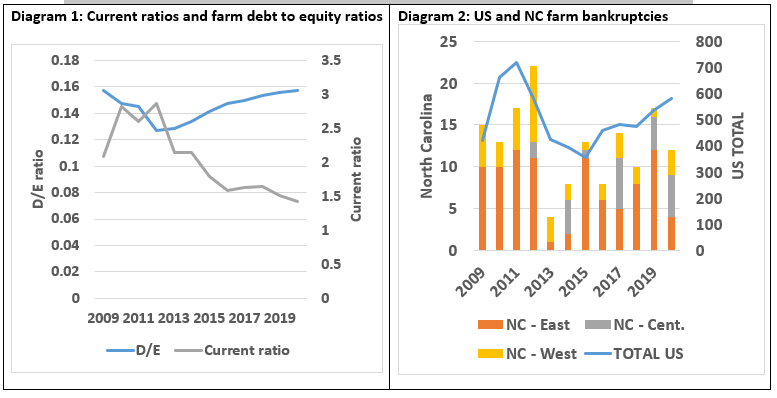
More than any industry, the impacts of COVID are experienced most swiftly and acutely in the food and hospitality sector, particularly sit-down dining establishments. Diagram 3 bears this out, illustrating that between March 1st to March 19th, establishments went from seeing small y-o-y growth on in-restaurant dining to essentially no in-restaurant dining – a fait accompli given mandated government closures in most states and general consumer aversion elsewhere. During the month of May, governors in most states with outright bans on sit-down dining began to allow for a partial reopening which included strict capacity limitations. While restaurant traffic has slowly ticked up since then it continues to lag badly behind last year – down 64% nationally (down 50% in the case of North Carolina).
With set calorie needs and fewer of those calories being purchased through restaurants, it stands to reason that Americans have been cooking more at home. Anecdotally this trend has revealed itself through notable curiosities, like flour shortages as more Americans have endeavored to do more baking, but also in big-picture data. Diagram 4 makes use of one such dataset maintained by the USDA, that tracks money spent on food consumed at home (FAH) and food consumed away from home (FAFH). The trend over time has been for Americans to spend more on FAFH but in March this long-standing trend turned on a dime, seeing the FAH share of the food dollar jumping from 48% to 66% – well above anything seen in at least 40 years.
This dramatic shift in the way food dollars are spent initiated a dramatic cascading effect on the rest of the food supply chain.
- It changed the kinds of food that were being consumed – Americans eat more fried food and different cuts to meat when they dine out. 2020’s COVID disruptions upset that balance.
- For a period, it rendered a large portion of the food delivery system useless or inefficient – Food destined for restaurants and institutions is packaged differently and with separate cold storage chains than that destined for retail.
- But perhaps most importantly, it concentrated food distribution into fewer hands, particularly that of large grocers, increasing their market power in the process.
COVID hit meat processing on a number of fronts
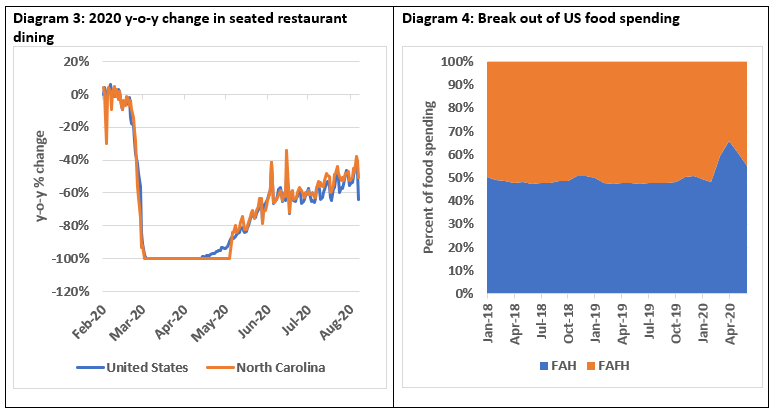
With disruptions in the cold storage supply chain and changes to meat breakdown and packaging, some meatpackers were, at least initially, unable to meet the needs of a quickly evolving customer base. However, the more material impact to the meatpacking sector came from within, in the form of coronavirus outbreaks in their own plant. To stem the outbreaks, meatpackers had to temporarily shutter plants and take steps to create social distance and erect physical barriers – all of which hampered productivity. These actions can be seen in weekly slaughter rates for hogs, cattle, and to a far less extent in poultry (Diagram 5).
After sliding over the course of 2019 under the weight of heavy inventories, hog and broiler prices had largely stabilized by the turn of the year. Processing disruptions brought an end to that, however. In the case of poultry, where disruptions were minor, the price impact on poultry was short-lived. In the case of hogs, however, it led to a 35% price drop between March and July, with prices showing some signs of a rebound in the first few weeks of August.
How have developments in on-farm and retail pricing impacted value capture in animal protein?
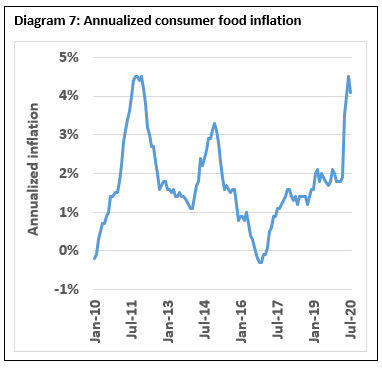
COVID has clearly caused retail prices to rise (Diagram 7) and farmgate prices to fall. This widening gap begs the question of who is capturing this additional margin in the animal protein supply chain?
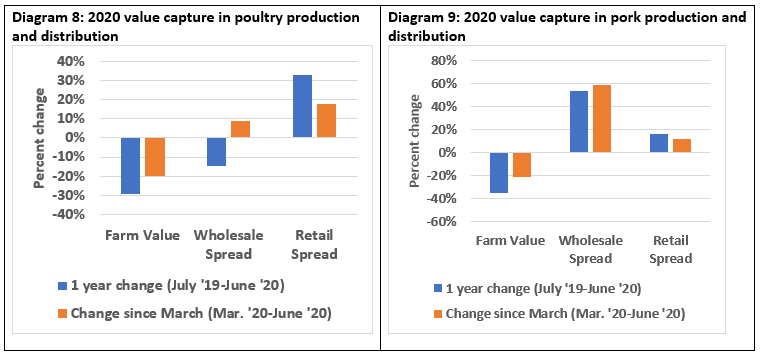
To answer that question definitively, one must look at the wholesale spread, a series that is maintained by the USDA for numerous species. In the case of poultry (Diagram 8) and hogs (Diagram 9) we observe that in the post-COVID period (March 2020 onward) the retail margin was up but the wholesale margin was higher still. The impact on the wholesale margin was particularly pronounced in hogs, where it increased by 60% in the observed time frame. By comparison, the wholesale margin increased 20% in poultry while the increase in the retail spreads for both species was comparable at around 15%.
What can these margins tell us about profitability?
In the case of livestock farming and in retail sales of animal proteins, the spreads illustrated in Diagrams 8 and 9 serve as highly illustrative indicators for how profitability has changed due to the fallout from COVID. An in-depth analysis of farm-level profitability is beyond the scope of this blog post but the 20% drop in farmgate prices for hogs has not been met by a comparable drop in feed and other costs, meaning profitability is down. That 60% of CFAP funding was outlaid for livestock products (68% of support distributed through August) speaks to just how challenging conditions have been for livestock farmers, ranchers and dairymen in 2020.
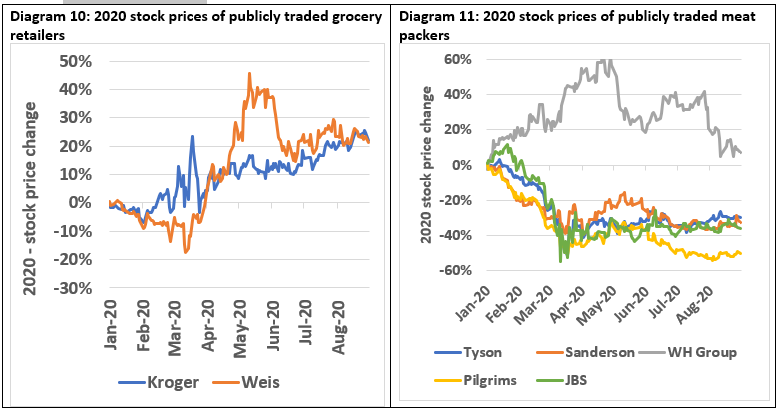
On the opposite side of the coin is retail, where COVID-related cost increases have been marginal and entirely eclipsed by higher retail margins. The evolution of stock prices for publicly traded grocery retailers (Diagram 10) points to just how profitable the grocery business has been over the course of 2020. From the beginning of the year through August, stock prices for Kroger and Weis, the two largest publicly traded grocers in the country have climbed more than 20%, while the broader Dow has been limited to break-even.
Between the farmer losing money and the grocer, who has seen its fortunes improve during the observed time frame, lies the wholesaler. Looking at the wholesale spreads illustrated in diagrams 8 and 9, one might mistakenly conclude that meatpackers have had a good run since the arrival of COVID. Although the difference in the value of live animals and wholesale meat (processing margins) has increased, COVID-related costs for most meatpackers have been higher still, leading to losses in most cases.
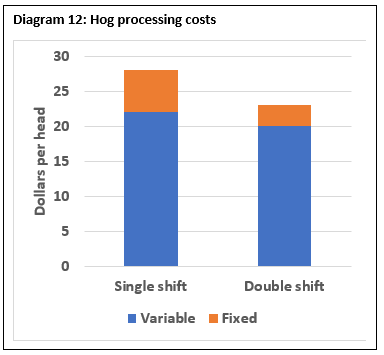
Meatpacking plants are designed to be high volume operations and any disruptions to throughput can have significant ramifications for costs. Diagram 12 demonstrates this point by illustrating how reducing throughput from the equivalent of two shifts to one, the equivalent of a 95% drop, can increase processing costs by $5 per hog. While few plants saw this level of reduction, at its peak throughput was down 35-40%, with industry economists estimating a $2-3 per hog increase in processing costs as a result.
COVID-related costs for meatpackers also include the added expense of personal protective equipment (PPE) and retro-engineering facilities to reduce the risk of disease transmission. While not every packer has reported these costs explicitly, we know that at least in the case of Smithfield and JBS/Pilgrim’s it has exceeded $100 million each.
While most meatpackers have now returned to normal attendance policies, at the peak of the crisis, JBS/Pilgrims, Smithfield, Tyson, and Sanderson collectively allocated hundreds of millions of dollars for bonuses, enhanced health coverage, and to pay employees to stay home – all of which ate into earnings and weighed on stock prices.
Finally, the wholesale margin reported by USDA assumes a static set of sub-primal and secondary cuts of meat. To accommodate post-COVID processing constraints, however, many packers shifted to more primal cuts, which comes with a lower sales price. Accounting for this shift would also explain some of the losses illustrated in Diagram 11.
How did WH Group outperform its competitors?
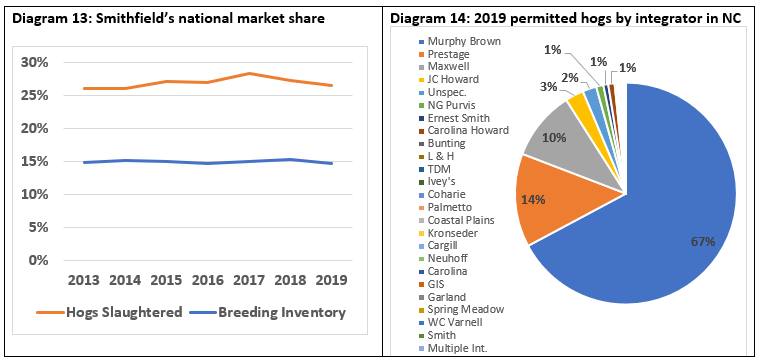
As the biggest pork and hog producer in the world, in the United States and in North Carolina WH Group occupies a special place in the imagination of soybean farmers and others involved in the livestock value chain. Since WH Group acquired Smithfield Foods in 2012, it has grown its hog herd and kill capacity to maintain market share at 15% and 27% respectively, in a growing US market. During that same time frame, Smithfield’s dominance of the North Carolina market has only grown, reaching 67% in 2019, a trend that is likely to continue with Maxwell Food’s announcement that it is exiting the hog business.
In diagram 11, we plot stock prices for major, publicly-traded meatpacking companies over the course of 2020. Looking at those meatpackers based in the Western hemisphere, we see steep drops in stock prices across the board, ranging from declines of 30-50%, even while the broader market had recovered earlier losses. WH Group, based in Hong Kong, however, managed to defy the same trends that weighed on its competitors, with its stock up 7% over the same period.
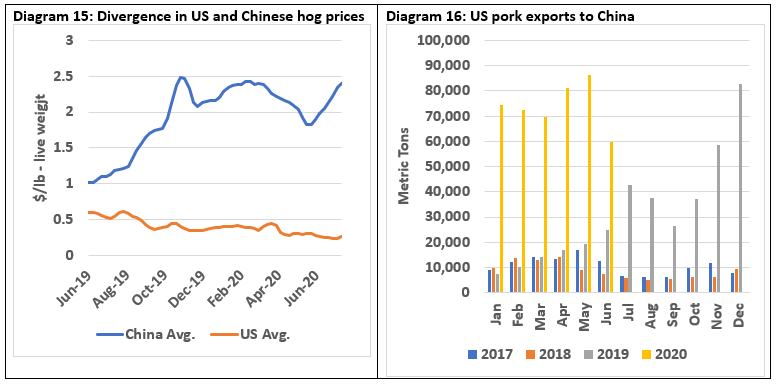
What has set Smithfield and WH Group apart? As a company based in China, in possession of that country’s largest cold-chain logistics network, WH Group has been uniquely positioned to profit from the widening gap between the US and Chinese pig/pork prices (Diagram 15) – itself a symptom of the African Swine Fever that came to the fore in late 2018. Acting on this arbitrage opportunity, exports of US pork to China increased from less than 10,000 MT per month in Jan 2019 to 85,000 MT in May of 2020 (Diagram 16).
How have COVID-related disruptions filtered back to soybeans?
While WH Group has been better positioned than its competitors, the impact of COVID has clearly been negative to the livestock industry as a whole. And though kill capacity in the US has largely recovered, the processing disruptions that peaked in April and May resulted in millions of fewer animals slaughtered, raised, and fed, with impacts continuing to reverberate across the agricultural economy.
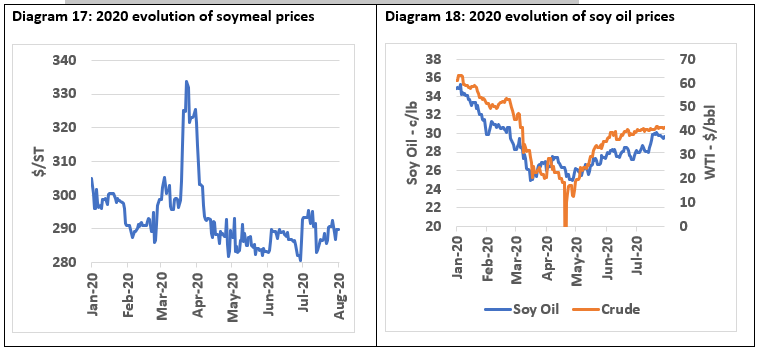
Given that ¼ of soybean meal is estimated to be consumed by hogs (half to broilers), the temporary drop in meal demand from these species has important ramifications for soybeans. In early March, increased demand from China coupled with COVID-related clampdowns at South American ports caused US meal prices to surge. This rally was short-lived however as the reality of reduced domestic demand began to take hold, with subsequent declines reducing the price of meal by 5% from where it began the year (Diagram 17).
COVID impacted the price of soybean oil as well. Given the biodiesel link, movements in the price of petroleum will ultimately be reflected in the price of vegetable oils. The decline in travel associated with COVID and the associated price war that broke out between Russia and Saudi Arabia was deleterious for crude and soy oil alike, with the latter falling 30% between January 1st and late April (Diagram 18).
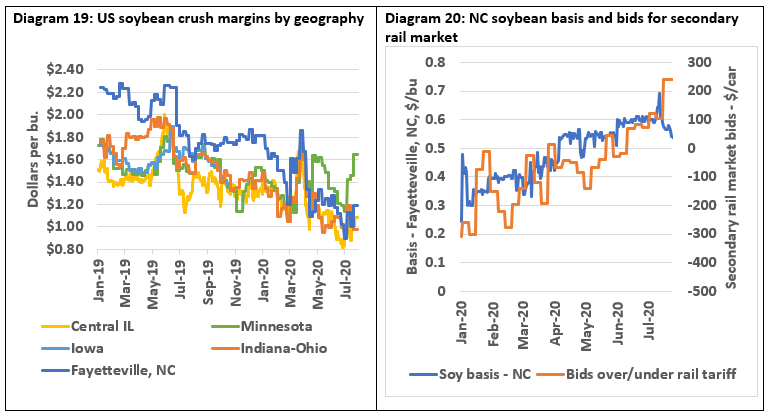
With the value of soy’s component parts falling, one might expect that the price of whole beans would have followed suit. Soybeans have been surprisingly resilient, however, with crushers seemingly paying the price for lower by-product values through lower crush margins (Diagram 19). In the case of North Carolina, an increase in basis, perhaps related to a recovery in rail rates, has further benefited growers in the state at the expense of the local crusher (Diagram 20).
COVID’s impact on exports
In recent years, North Carolina soybean exports have averaged 7-10% of the states production with essentially all exports being done via containers. Like so many other things, however, COVID has disrupted the availability of containers in the US through 1) factory shut downs in China, which led to fewer consumer goods being shipped to the US in containers and 2) port shutdowns in China which led to a temporary backlog in containers vessels waiting to be unloaded. These disruptions are reflected in container shipping rates, for which the global index has increased by 25% over the course of the year (Diagram 21). With these disruptions, the pace of soybean exports has fallen 50% below that of last year and 60% below that of 2018 (Diagram 22).
