Since record-keeping began in 1851, the daily probability for a named storm being present in the Atlantic Basin peaks on September 10th. While that day has come and gone, and the state’s agricultural interests dodged a bullet in Hurricane Dorian the Atlantic hurricane season does not end until November 30th – making now a good time to talk about the merits of crop insurance as a tool for mitigating risk.
In this blog post, we review the compelling set of rationale for purchasing crop insurance but also dive further, into some new analysis of RMA’s actuarial data that may help growers optimize the structure and level of coverage of insurance for their operation.
The rationale for purchasing crop insurance has never been stronger
In 2018, more than 85% acres of soybeans planted in the state were insured. While the importance of crop insurance is clearly not lost on the state’s growers, not all may be aware that the rationale for purchasing crop insurance has grown more compelling in recent years and will likely continue on this trajectory in the medium term.
- Farms are not currently well-positioned to take risks. The potent combination of low crop prices and stubbornly high input costs have put many farms’ financial indicators at their worst levels since the crises of the 1980s. Looking at the farm economy holistically, most of the reserves built up in the commodity boom of 2008-2014, have since been depleted and while MFP payments provided a temporary boost to income, many problems remain.
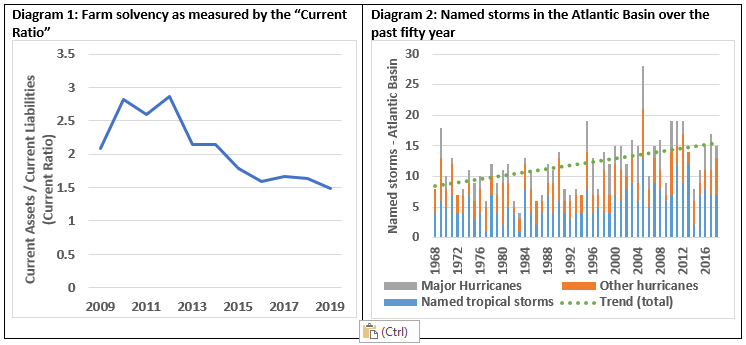
Diagram 1 plots one of the most commonly used financial metrics employed by Ag Lenders, the so-called “current ratio” – a measure of farm solvency. This metric has been trending downward since 2013 and this year is projected to fall below 1.5, the ratio deemed “acceptable” for most lenders. While the ratios involved here may be lost on the non-bankers among us, the idea behind it clear. Farms today have more short turn liabilities and less liquidity on hand meaning that in the event of a crop failure, it could be difficult to repay loans as they come due.
In today’s low-margin environment growers are looking for cost savings wherever possible. But, in general, and especially in times of low liquidity growers cannot afford to not have crop insurance.
- Weather is becoming more unpredictable. Whether you believe climate change is natural or man-made; a temporary aberration or a more permanent fixture, data suggests that we have been living with it and will likely continue to live with it for the foreseeable future. While hurricane Dorian came and went without much impact, we are only a year removed from the devastation that hurricanes Florence and Michael brought to the state. As a coastal state with some of our most productive agricultural regions in low-lying areas, the North Carolina agricultural sector remains particularly susceptible to hurricanes.
Diagram 2 illustrates the heightened threat of tropical storms and hurricanes to the state over time. Fifty years ago, for example, the Atlantic Basin averaged just eight named storms a year. Today, that figure exceeds 15. Fortunately, the incidence of drought in the state has not exhibited the same upward trend but neither has it abated. With ocean temperatures continuing to rise, tropical storms hitting the state will become more frequent and more severe, increasing the need for crop insurance.
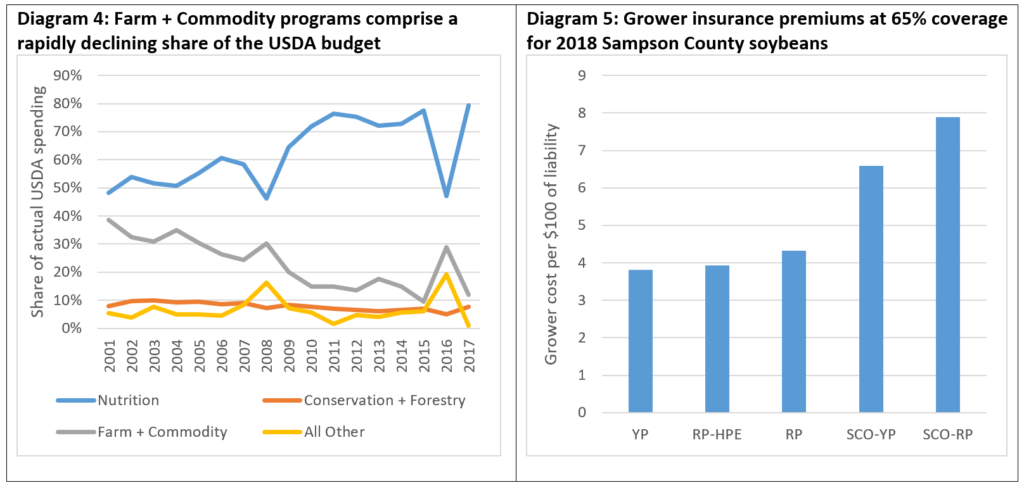
- Crop insurance has become one of the primary means of federal support to agriculture. Twenty years ago, both the composition of USDA spending and the federal safety net to agriculture looked much different than they do today. In 2000, for example, Farm & Commodity programs comprised around 40% of USDA spending whereas in 2017, they accounted for closer to 10% (Diagram 4).
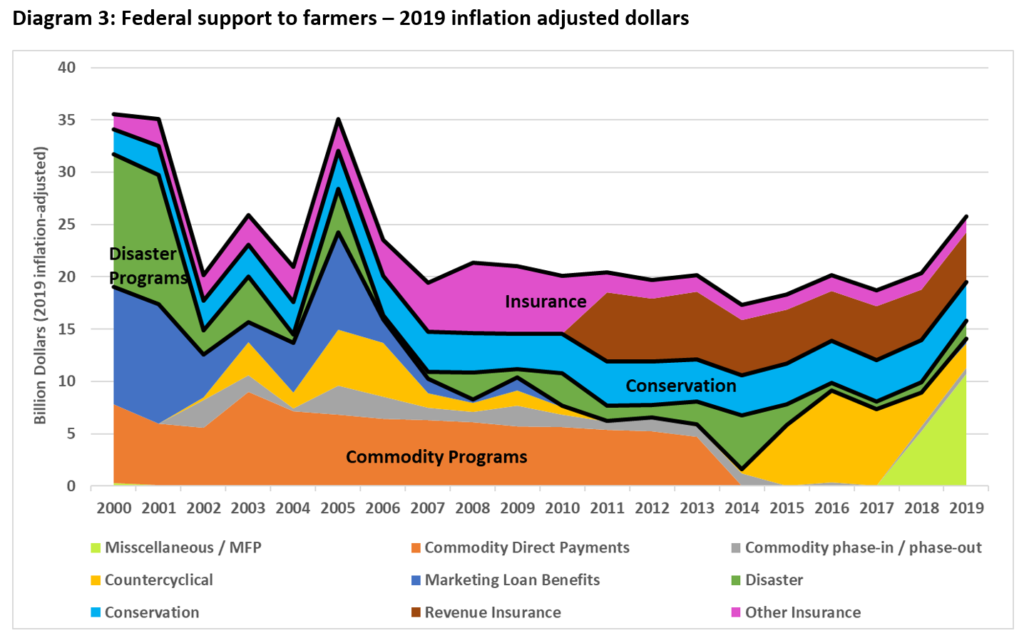
Through this, federal support to agriculture in has managed to hold fairly steady in inflation adjusted terms but the means in which that support is delivered has changed markedly (Diagram 3). In the period covered under the 2002 Farm Bill (2002-07), for example, 63% of grower support, on average, was delivered through traditional commodity programs while just 15% came in the form of support to crop insurance. Since the 2014 Farm Bill, on the other hand, support delivered via commodity programs has averaged just 37% of the total, and would have been far lower had it not been for the ad hoc MFP payments. The share of farmer support delivered via crop insurance, meanwhile has increased to 33% on average.
The takeaway here is that once upon a time, growers could be fairly passive in their participation in federal programs and still count on commodity programs and disaster payments providing support when things got bad. Today, a grower who wants to benefit from the federal safety net to agriculture must put their own skin in the game and purchase crop insurance.
Analysis of RMA data can provide insights into how to best structure crop insurance
Although the choice to purchase crop insurance should be an obvious one in most cases, growers are presented with many options in terms of insurance policy type and coverage level. While how a grower goes about structuring his/her crop insurance policy is a highly individualized choice, an analysis of RMA data for soybeans in North Carolina over the past ten years seemingly provides some generalizations that could help growers optimize the structure of their policy going forward.
Types of policies available
Since 2011, there have been two primary policy types continuously, and one policy variation, available in North Carolina.
- Yield Protection (YP) – The most basic RMA policy, yield protection guarantees a yield based on ten years of Actual Production History (APH). This can be sold with or without a trend adjustment (TA) factor for most counties in the state. Value of crop lost is based on a projected price, determined for NC to be the average Jan. CBOT price between Jan15th-Feb 14th.
- Revenue Protection (RP) – Offers all of the coverage of yield protection plus the option to use either the projected price or harvest price, whichever is higher. In NC the harvest price is determined using the average November price for the Jan. CBOT contract.
-
- With harvest price exclusion (RPHPE) – An optional provision on RP which limits revenue guarantee to the Jan/Feb futures price. This prevent lost yield from capturing any increase in the harvest price but also reduces premium cost.
Coverage for YP, RP and its variants ranges from 50%-85%. There is also a catastrophic option (CAT) that acts like YP at 50% coverage but only covers 55% of the projected price.
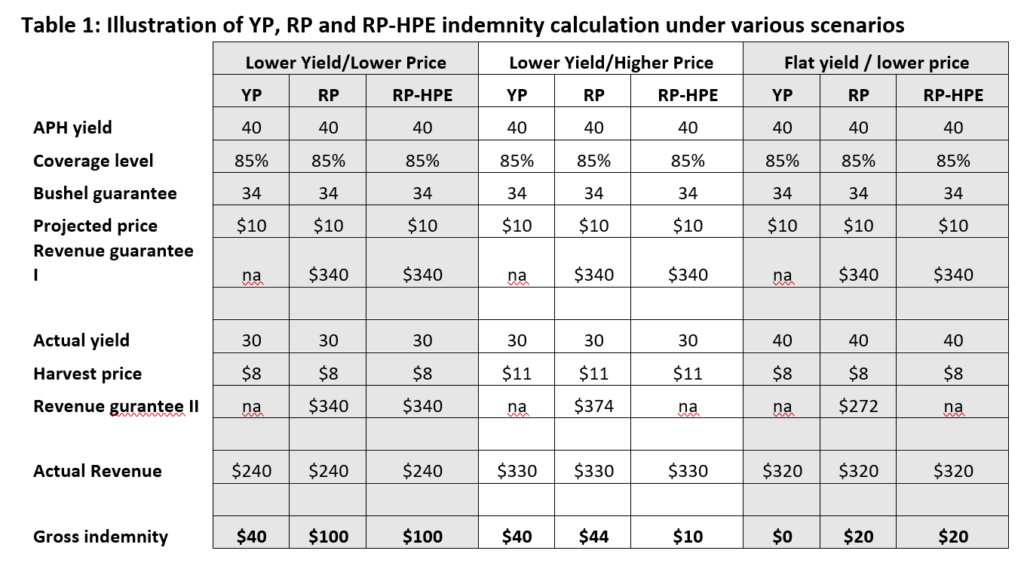
Since 2014, three more policy types were introduced for a grand total of five primary policy types
- Supplemental Coverage Options (SCO) – The SCO is a county-level crop insurance option that provides additional coverage and is offered as an endorsement on Revenue Protection (SCO-RP), Revenue Protection with HPE (SCO-RPHPE) and Yield Protection (SCO-YP) policies. For the underlying RP, RPHPE or YP policy an indemnity is triggered when there is an individual loss in yield or revenue. For the SCO endorsement, an indemnity is triggered if yield or price drops at the county level. The SCO begins to pay when county revenue falls below 86% (set by law / same for all policies) and pays out its full amount when falls to the coverage level of underlying policy. SCO and ARP cannot be purchased on the same crop on a given farm.

- Area Risk Protection (ARP) – Area Risk Protection Insurance, is an insurance plan that provides coverage based on the experience of an entire area, generally a county. ARPI replaces the Group Risk Plan (GRP) and the Group Risk Income Protection Plan (GRIP). The YP, RP and RP-HPE options are all available under ARP.
- Whole Farm Revenue Protection (WFRP) – WFRP provides a risk management safety net for all commodities on the farm under one insurance policy. Because of the whole-farm coverage of WFRP, RMA does not show indemnity data by commodity.
Optimal policy types and coverage levels across NC soybeans over the past ten years
The primary goal of insurance is to mitigate risk to an acceptable level. But, a secondary goal for growers should be to structure their policies in such a way that they minimize the dollars they pay into a policy for every dollar they draw out. Typically, the goal for an insurer is just the opposite but in the case of crop insurance, this truism does not necessarily apply given that it is offered as a means of farmer support rather than a profit vehicle for the RMA.
RMA reports subsidy factors for policies by coverage level and it may be tempting to conclude initially that policy options with the highest subsidy are inherently the best value from a farmer’s perspective. However a subsidy factor, explicitly applies to the policy premium and while a premium should be a reflection of risk, there is evidence that RMA is not always perfect in its actuarial calculations.
The ratio of money paid to money paid into a policy is known in the insurance industry as the adjusted loss ratio. Because the Adjusted Loss Ratio it takes into account the cost of the premium (money paid in), the government subsidy on the policy and the value of the indemnity (money paid out) it is a better metric to evaluate those policies that may be the “best deal” to growers.

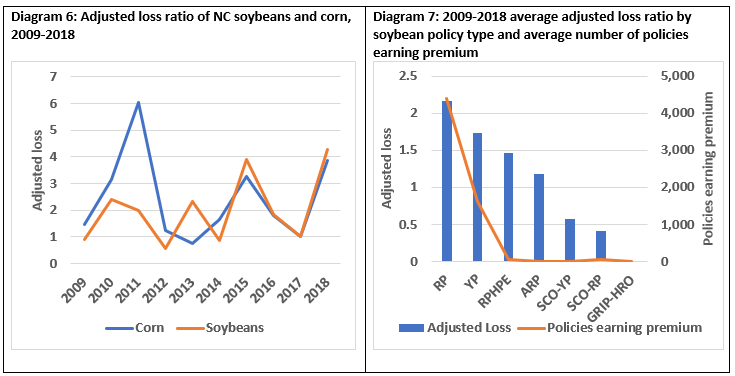
Diagram 6 illustrates the adjusted loss ratio on all corn and soybean policies in North Carolina dating back to 2009. Since that time, the loss ratio for corn has averaged 2.4 while for soybeans it has average 2.0 meaning that for every dollar NC soybean growers have put into crop insurance, they have received two dollars in return.
In addition to being able to calculate adjusted loss ratios by commodity, RMA also allows us to make that same calculation by policy type. Diagram 7 present this information for policies held on NC soybeans between 2009 and 2018. Here we observe that over this timeframe the adjusted loss ratio was 2.16 for Revenue Protection and 1.74 for Yield Protection with the ratio declining from there on other policy types. Also on Diagram 7, we have plotted the average number of policies earning premium by policy type and observe that most growers opt for RP with a sizeable minority opting for YP while very few choose the four other policy types reported. Taken as a whole, the diagram suggests that bulk of the state’s growers are making the most optimal selection by policy type, at least when viewed through the clinical eye of ten-year, statewide averages.
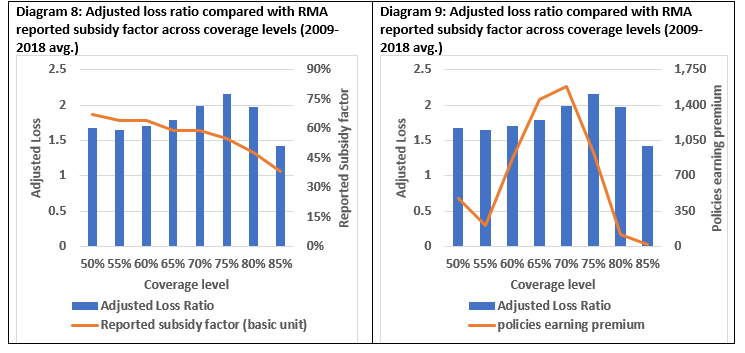
In Diagrams 8 and 9 we extend the same analysis on Adjusted Loss Ratios by making the calculation by coverage level. Interestingly, we observe that over the past ten years, the Adjusted Loss Ratio for soybeans has been highest at the 75% coverage level. Given the fact that RMA reports a subsidy factor that is highest for 50% coverage this would suggest some disconnect in terms of how RMA is calculating risk (Diagram 8). In Diagram 9 we observe that the majority of the state’s soybeans policies are found in the 70% or 65% coverage levels even though statistically speaking, growers, when taken as a whole, would have been better off with 75% or 80% coverage over the ten-year time frame.
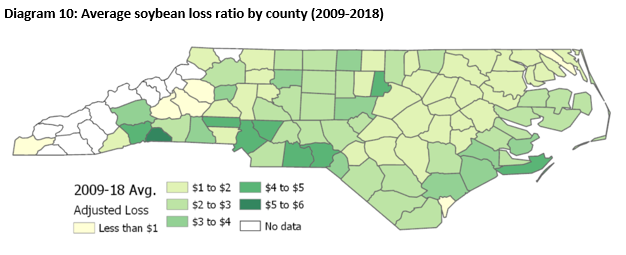
In Diagram 10 we conclude our analysis by depicting Adjusted Loss Ratios on a county-level basis. In this map, darker green counties can be interpreted to have received a better return on their crop insurance purchases over the past ten years. While some of the highest returns were seen in small-production counties in the western part of the state, a number of medium-production counties, namely Carteret and Stanly also stand out in terms of their Adjusted Loss Ratios. Another conclusion that can be drawn from this map is that historically speaking, returns on crop insurance were higher in the Blacklands, Piedmont and Sandhills than in the Coastal Plain.
Summary and conclusions
The rationale for purchasing crop insurance has never been stronger given 1) currently low levels of farm liquidity, 2) greater variability in weather and 3) the fact that a growing share of federal support to agriculture is being delivered in the form of crop insurance.
While the case for crop insurance is clear, the RMA offers a multitude of policy options and coverage levels requiring a number of informed decisions by the grower in order to optimize his/her policy. One useful metric at growers’ disposal I this exercise is the Adjusted Loss Ratio, which distills the dollars paid into a policy and dollars paid out into one number. An analysis of RMA data suggests that between 2009-2018, Revenue Protection has been the best policy type by this measure and that 75% has been the most optimal level of coverage. While NC soybean growers overwhelmingly choose Revenue Protection as their insurance type, historical data suggests that when taken as a whole, they could be better served by purchasing more coverage. Geographically speaking, while crop insurance is a good deal everywhere, it has offered the best returns outside of the Coastal Plain.
While this analysis hopefully provides some useful food for thought, it is in no way a substitute for the more holistic considerations that should be discussed between growers and their crop insurance agents. In fact, the most important takeaway from this analysis should not be any kind of hard and fast conclusion on what kind of policy type or coverage level is “best”. Instead, it should demonstrate that in the realm of crop insurance, data abounds, and that a crop insurance agent making a policy recommendation should be able to back it up with a strong empirical argument.
—
Note: Following on the work done by Dr. Stowe last year, RMA will begin offering crop insurance policies for food-grade soybeans for the 2020 crop. Policy information will be released in November.
|
Key Dates 1/: |


