Driven, by historically tight stocks, the prospect of a third La Nina in South America and rapid inflation spurred by historically cheap money, CBOT soybean prices surged through the spring and settled into an elevated plateau marked by pricing volatility typical of the summer months. After reaching a record high of $17.69 per bushel on June 9th, however, CBOT prices have been on a downward spiral, shedding $4.25 in value through the end of July.
Below, we explore some of the macroeconomic factors at play behind a decline which has taken place against the backdrop of strong fundamentals. We then conclude with a discussion of the factors behind the record high basis safeguarding NC growers from the worst of these falling prices, namely record container exports out of Wilmington and stubbornly high transportation costs – anathema to Midwestern agriculture but a boon to East Coast soybean production.
 Role of the dollar, the world’s reserve currency
Commodities are global assets, meaning they are traded all over the world. The vast majority of commodities are traded in US dollars because of its role as a reserve currency and a reflection of the fact that the US is a large, stable economy that exercises relative fiscal discipline. Even tea, the most British of all beverages, is traded in dollars rather than sterling. This is a critical consideration because it means that as the dollar strengthens it makes commodity purchases more expensive for consumers overseas incurring the expense in local currency. This increased cost curtails demand in those countries, ultimately making the product cheaper for Americans purchasing in dollars. When the dollar weakens, the opposite sequence of events plays out.
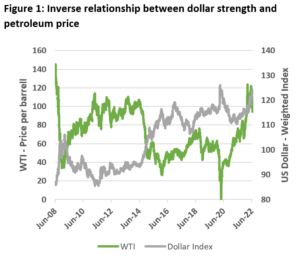
Figure 1 illustrates the inverse relationship between the dollar and WTI crude. Historically, this (inverse) relationship was watertight and while the relationship remains, it has weakened somewhat in recent years as the US petroleum production has grown to the point that high oil prices can actually add to the US balance sheet and bolster the dollar.
Economic indicators flashing signs of a recession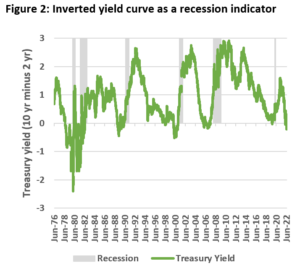
Figure 1 illustrates the degree to which petroleum responds to the macro-economic signal of dollar strength but its biggest drivers are fundamental factors like production and consumption – the latter of which is influenced by the strength of the economy. On this score, petroleum markets are currently being shaken by the looming threat of recession. Economists look at many factors when trying to predict a recession but one of the most popular, and most accurate, has historically been the long term treasury yield spread. The treasury yield spread is the difference between the 10-year and 2-year treasury. Generally, the difference between a 10 year and 2 year yield should be positive because investors will demand a greater return to lock their money away for a longer period of time. However, when investors become fearful of a sharp downturn, perhaps because the Fed is pushing short term rates too high, too quickly, they may be willing to accept less for a longer term investment, leading to a flat or inverse yield curve. In figure 2 we observe how an inverse yield curve has accurately predicted every recession since at least the 1970s and suggests that another recession could be just around the corner, a fundamentally bearish factor for petroleum.
 Falling petroleum prices weighing on all commodities, but especially vegetable oils
It’s no secret that commodity markets move in concert. Agricultural commodities have always competed for acres, making it difficult for any one crop to get detached from price cycles for too long. Now, with biofuels so central to demand (40% for corn and 40% for soybean oil) agricultural price cycles are inextricably linked to price cycles in petroleum.
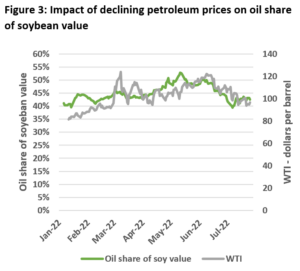
Intuitively, given the large share of their value in oil, the petroleum link is especially strong for oilseeds. Over the last two years, as petroleum prices have surged and renewable diesel capacity has quadrupled, there has been tremendous emphasis across the trade on oil’s growing share of soybean value. Since peaking at 53% in mid-May, however, oil’s share of soybean value has fallen in lockstep with petroleum. As a result, of the $4.25 of value shed from soybean futures at their peak (at the time of writing), $3.00 was lost from the oil component of the bean.
Enter record North Carolina basis
While the 7 weeks following the June 9th peak in prices haven’t been much fun, prices remain historically high and North Carolina growers remain in the enviable position of being distanced from the worst of what’s been happening in Chicago by a basis that has reached record highs.
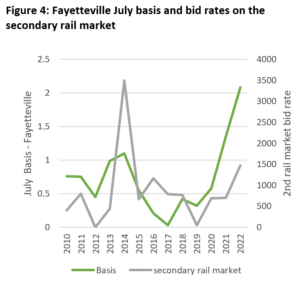
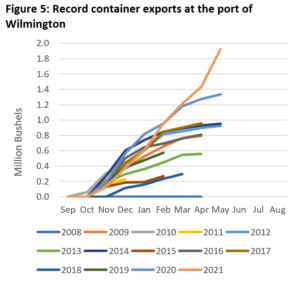
Supporting local basis include accidental factors, like high railroading costs, but also a vibrant and growing container market, something the NCSPA has worked tirelessly to promote in recent years. Figure 4 illustrates how July basis has propelled upwards of $2 per bushel this year in conjunction with the highest rates in the secondary rail market seen since 2014, a reflection of logistical tie-ups, and an overall environment of high costs for railroaders. Just as important to the strength of local basis, however, has been the step change in containerized exports out of Wilmington since Smithfield ramped up its activity in 2021 and Scoular opened its high-speed container loading facility there earlier this year.
With high prices for inputs coming on the heels of a trade war and global pandemic, North Carolina soybean farmers could certainly use a “win” this year. If we can get good weather in the home stretch (knock wood), it would appear all the ingredients are still in place to deliver one for 2022/23.
 |
 |


