Every year, on March 31st the USDA releases its prospective plantings report – the first official glimpse into where acreage will shake out for the coming year. The report is based on grower surveys performed in the first two weeks of March and the timing of its release is a function of fairness, i.e. everyone receiving market moving information at the same time, but also a reflection of the labor intensive nature of surveys
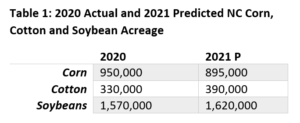
Although acreage is driven primarily by rotational considerations, statistical evidence and intuition also suggest that the potential for profit is also a strong motivator when growers are making planting decisions across crops. In this blog post, we develop predictive models for soy, corn and cotton acreage on the basis of relative prices and input costs at the time that planting and purchasing decisions are made, which allows us to formulate a projection in advance of USDA’s March report. The predicted value of these models is then compared to USDA’s final acreage figures where we find them to be more accurate in the case of corn and soy and marginally less accurate in the case of cotton. Applying the model for 2021 we project An 18% increase in cotton planted area, a 3% increase in soy acreage and a 6% decrease in corn area for the upcoming season.
Background and methodology
When thinking about the breakout of crop acreage in the US, many in the ag sector think about crops “competing” for acreage within the guardrails laid out by rotations and weather. Starting from that premise, it’s important to begin by recognizing that in meaningful terms soybeans compete mainly with corn and cotton for acreage in North Carolina.  Although the mix of spring-planted crops in North Carolina is incredibly diverse, crops like tobacco, sweetpotatoes and peanuts command only a fraction of the acreage and in the case of the first two, may have labor needs that do not make them direct substitutes for corn, cotton or soy.
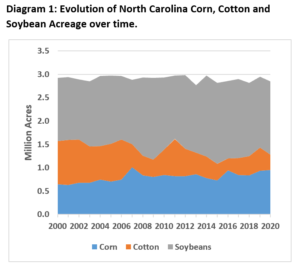
Diagram 1 illustrates how North Carolina corn, cotton and soybean are linked though this “competition” for acres and shows that despite the steady loss of farmland in the state, combined acreage for these three crops has held steady at roughly 3 million acres. Because corn, cotton and soybeans are competing for the same acres in many cases, one cannot take an informed view on prospective soybean acres without also taking a position on prospective corn and cotton acreage.
Projecting cotton acreage
As shown in Diagram 1, cotton acreage in NC has declined considerably over the past 20 years. In 2000 cotton covered close to a million acres of cropland in North Carolina, a figure that had declined to just 330,000 acres in 2020. While the cost to make a crop increased for all commodities during that time frame cotton stood out as seeing the biggest cost increases, in both absolute and relative terms. Although there are many reasons for these increases, a frequently cited one in the case of cotton was the transition in the industry from basket to modular pickers beginning in 2008 which effectively doubled the cost of machinery. Since then, the cost of a new modular picker has increased from $600,000 to $1 Million gradually raising the acreage requirements for cotton farming and pushing smaller farmers into other crops. We accommodate this industry transition by incorporating a time variable into our cotton projection model.
While a time variable addresses the downward trend in acreage it does nothing to address the ups and downs seen from one year to the next. For this, we must incorporate a variable to reflect price. As we will see in the case of corn and soy we achieve the best results by looking at the interaction of prices between the two. In cotton, however, a better model is achieved by looking at the cotton price alone. Most likely this is due to the fact that because sunk costs in cotton are so high, once cotton prices are sufficient to cover variable costs, many growers will opt for cotton with less regard for what is happening in corn and soy markets.

Projecting corn and soybean acreage
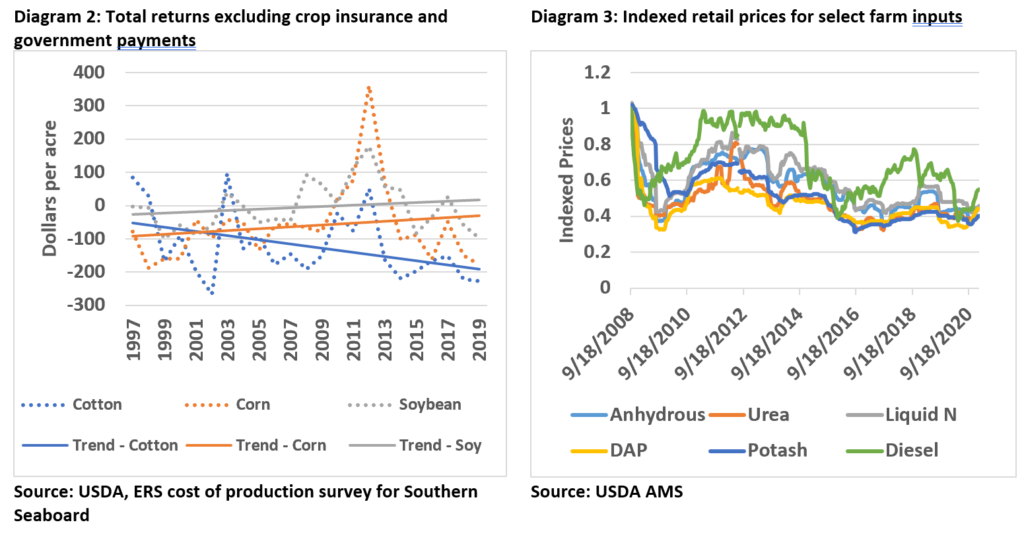
Assuming cumulative corn and soybean acreage is static at around 3 million acres, once cotton acreage is projected, corn and soybean acreages can then be projected by determining the ratio between the two.Unlike cotton, a time variable is of no utility when projecting the ratio of soy/corn planted area in North Carolina because the revenue trend for corn and soy is the same – steadily upward over time.
Instead, to project the ratio of soy/corn planted acres we look first to relative soy and corn prices at the time purchasing decisions are made. In the case of corn and soy, decision-making window is typically late fall/early winter compared with early spring for cotton. While soy and corn prices are a critical first step, in that they account for the revenue side of the equation, they say nothing about costs. Relying more heavily on fertilizer and fuel, corn costs are higher than soy but these can show great variability from year to year, a fluctuation that growers monitor closely when making planting decisions. While these costs could all be addressed individually, for the sake of simplicity, we have based our model on just one input, urea. As shown, in Diagram 3, however, urea acts as a reasonable proxy for other key inputs given that they move together over time.
Results
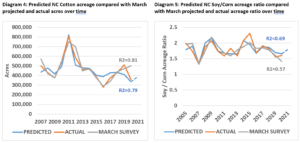
In Diagrams 4 and 5 we compare our model predictions to USDA’s historical March projections and final acreage figures for the year. From these diagrams we observe that the predicted value for cotton is only marginally less effective than USDA’s March survey in projecting actual acres while in the case of corn/soy, the model has actually been better historically at projecting acreage ratios than USDA’s March report.

 Applying these models for the 2021 crop year and assuming a three-year average corn, cotton and soybean cumulative planted area of 2.9 million acres we arrive at the planting projection figures in table 1. The USDA Prospective Plantings report will give us another perspective on North Carolina’s acreage outlook on March 31st while finalized planted acreage numbers are generally released in late June.

The strongly predictive nature of these models tells us that when farmers have leeway in their planting decisions – that is the flexibility they grant themselves outside of rotational considerations – they are generally making those decisions on the same data. What is more interesting though, is that growers appear to put a heavy emphasis on “present” data (October/November prices for corn and soy and March/April prices for cotton) when making decisions for a crop that will be harvested 6-12 months in the future. Knowing this raises a number of questions for future analysis, namely:
- How accurate is forward looking agricultural market data and how available is this data to growers? and;
- Are growers rewarded for responding to the same information in the same way as their peers or, recognizing the cyclical nature of commodity markets, would they be better off taking a more contrarian view?


