As the year comes to a close and harvest 2020 wraps up, it’s a good time to think about soybean production lessons learned not only in 2020 but over the years as you start planning for 2021. One place we can look for production practices that may be contributing to higher yields is the North Carolina Soybean Yield Contest.
The North Carolina Soybean Yield Contest has a long history of recognizing top producers in the state and sharing information about which Best Management Practices may help other growers increase yields. The NC Soybean Yield Contest in one of the longest running soybean yield contests in the country and data collected over the years is valuable in understanding how production practices have changed in our state over time, specifically in high-yielding situations.
While we won’t know the yield of the winning entries from 2020 for another few months, we did analyze the last 18 years of yield contest entries (877 total entries) to get a better understanding of practices that are being used in high-yielding fields as well as to get an insight into how those practices have changed over time.
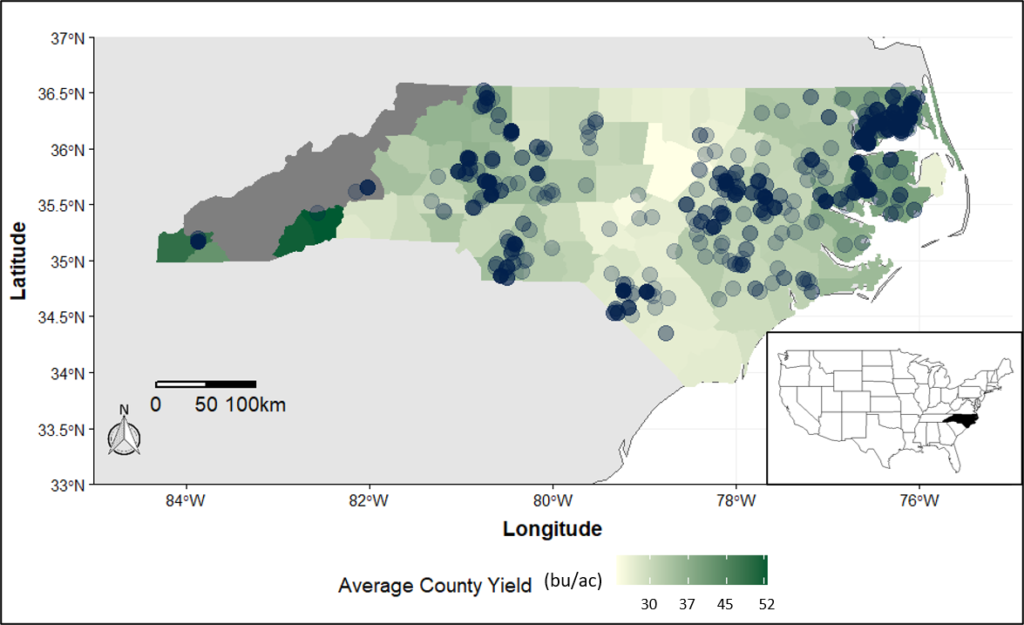
Over the 18-year period, entries were received from 58 NC counties (see map below), despite some of these counties having a very low average yield, allowing us to glean insights for both high and low-yielding parts of the state.

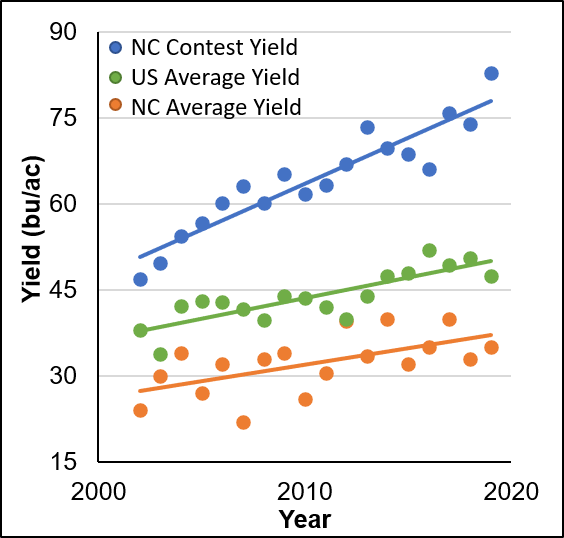
In the graph below, if we compare the average contest yields (blue line) to the state yields (orange line) over the time period it’s obvious contest yields were much higher (102% higher) than our overall state average. In addition, NC contest yields were significantly higher than the average US yields (green line), suggesting there is an opportunity to narrow the gap between our state average yields and the US average.

How might we use these contest entries to inform production practices going forward? Given the tremendous growth in contest yields over the observed time frame (averaging 1.5 bu per year) one approach might be to compare the corresponding evolution in production practices of historical contest entrants.
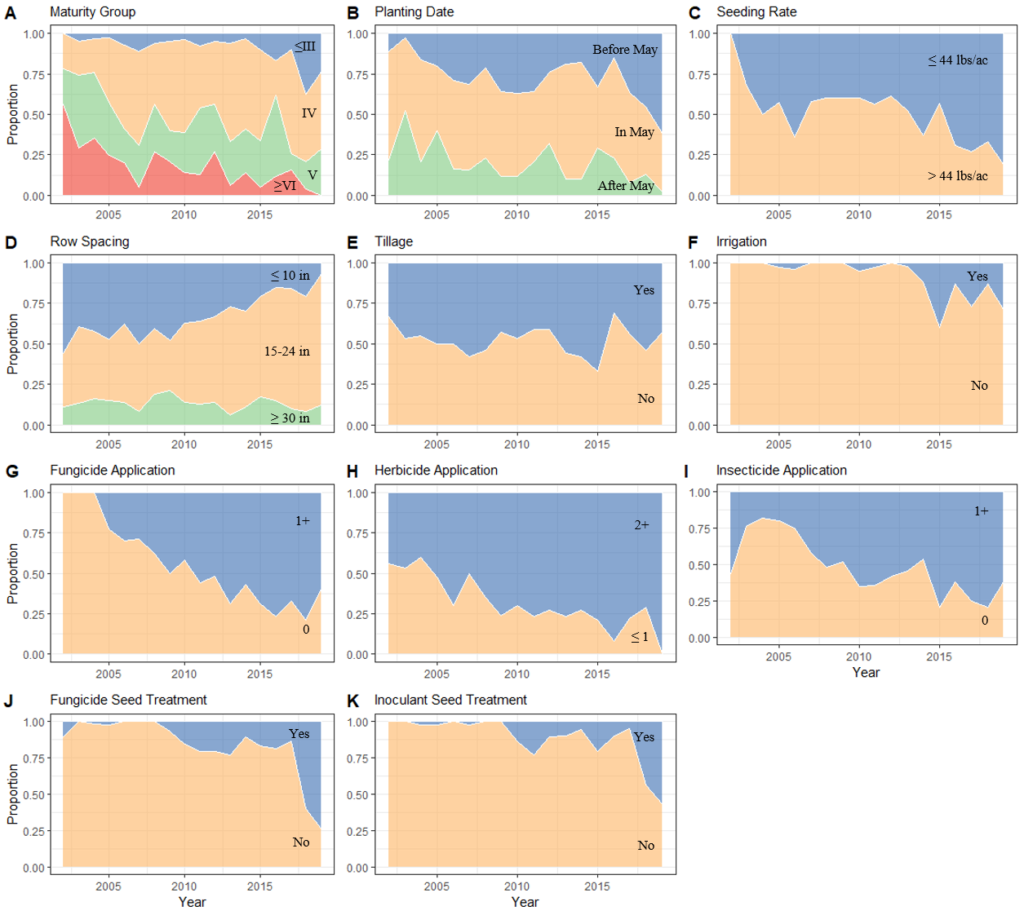
The graph below shows how 11 different production practices have changed over time. The y-axis represents the proportion of entries adopting the given practice in a given year while the X-axis shows adoption over time.

Maturity Group
Maturity group was one of the practices with the most significant changes over time. In 2002 more than 75% of the entries were a MG V or later, while in 2019 less than 25% were V or later, meaning a much larger proportion of growers were using earlier MGs (IIIs and IVs).
Planting Date
Planting date was another practice that changed significantly over the years. In 2002 less than 10% of the entries planted before May while in 2019 over 50% of the entries planted before May. Data from other studies has indicated that moving planting date up is an opportunity to increase yields.
Seeding Rate
Seeding rate is presented in lbs/ac as that was the common mechanism of reporting seeding rate when the contest began. Over the period of the study, there was a larger proportion of entries with a lower seeding rate as we moved through time. This suggests growers can lower their seeding rates while still maintaining high yields, which provides costs saving and in turn increases profitability.
Row Spacing
The composition of row spacing varied considerably over the study period, but the trend was a shift away from drilled beans (less than 10 in) and towards a 15-24 in spacing. While there is a good amount of data from other studies in our state indicating narrow row spacings increase yields, there are probably yield advantages from the precision gained by a planter versus using a drill that these contest growers are taking advantage of.
Tillage
There were little changes in tillage across the 18-year period, suggesting growers with both tilled and no-till systems can produce high-yielding soybeans.
Irrigation
Over the 18-year period there was a slight increase in the proportion of entries that used irrigation, but will a very small percentage of the soybean acreage in the state irrigated, this practice likely won’t be something most growers could take advantage of.
Fungicide Application
The number of fungicide applications was another practice that changed significantly over time. In 2002 no entries used a fungicide while in 2019 more than 50% of entries used at least one application. This suggests opportunities may exist for more aggressive scouting and management of foliar diseases in soybeans to protect yields. However, fungicide-resistance development has already been observed in some areas of our state and is an increasing problem in soybean production across the United States. To slow fungicide-resistance development while effectively managing foliar diseases, growers should use an integrated approach to managing foliar diseases, and not simply blanket spray.
Herbicide Application
The number of herbicide applications has changed over time, which is not at all surprising. Glyphosate tolerant crops became prevalent in the late 90’s and early 2000’s which means during the early period of this study many growers were only using one glyphosate application for weed control. But in 2005 the trend towards more than one herbicide application increased, which is when glyphosate resistance was confirmed in the state. The increase in herbicide use over time is likely an indication of greater challenges with herbicide resistance in weeds over the same period.
Insecticide Application
There was a slight increase in insecticide use over time, but no drastic changes suggesting growers in the soybean yield contest have been scouting and spraying for insect pests as needed through the entire period evaluated.
Seed Treatments
The use of a fungicide seed treatment and inoculant seed treatment have both increased over time with the greatest increase observed in the last 2-3 years. This isn’t completely surprising as growers that plant earlier are also more likely to benefit from a seed treatment as conditions for early planting beans are likely less favorable than those in later planting dates.
Looking at trends over time is only one piece of the puzzle of determining which practices have the greatest impact on yield. A more complete analysis of this data will be presented by Dr. Rachel Vann during meeting season this winter, so I encourage you to tune in (whether in person or virtually) to learn more about the practices that had the greatest impact on yield.
Also, it’s important to keep in mind, that what works in yield contest fields doesn’t always translate to what’s practical or profitable across a broader acreage, but I would encourage you to think about some of these trends as you plan for 2021. In order to increase yields across the state, growers must be willing to focus on increased agronomic management of the crop.


